ON THIS PAGE
The Cookie Banner Analytics allows you to see all necessary user statistics and interactions with the banner elements and Cookie Categories. You can use the Cookie Banner Analytics to experiment with banner settings and see how that is reflected in the user's behavior. cookie banner Analytics also allows you to analyze how many visitors actually agree with your Cookie Policy and adjust it accordingly.
The cookie banner Analytics will only collect analytics data if enabled in your CookieScript item settings. See the guide on how to collect CookieScript cookie banner analytics.
Main Features of Cookie Banner Analytics
Here are some features that are currently implemented in cookie banner Analytics.
Summary
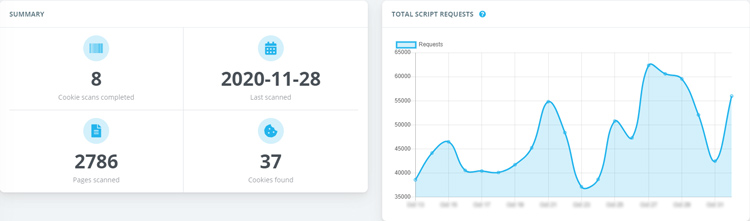
The summary section shows you general info about your Cookie Banner:
- Cookie scans completed;
- When was the website last scanned;
- How many pages were scanned during the last scan;
- How many cookies were found during the last scan?
Number of script requests
This graph shows how many requests per day were sent to our servers to get the cookie banner JavaScript code. One request usually means one pageview, unless Cookie Banner is cached in the user's browser.
User statistics
In December 2023, Cookie Banner Analytics introduces a valuable addition - now you can track the accept, reject, and ignore rates of your cookie banners! This insightful feature is fully integrated into the Analytics section of the banner, complementing our existing analytics data. Unlike other statistics, these rates are calculated per user, providing a more precise understanding of individual interactions with your banners.
For example, if a user accepts the cookie banner several times on different web pages, the updated cookie banner will show only one event, not several events, as it was before.
To start seeing user interaction rates, simply re-save your banner, and you'll begin collecting this new set of data. Remember, Cookie Banner Analytics is an exclusive feature of our Plus plan.
The user statistics shows accept, reject, and ignore rates of your cookie banner, calculated per user:
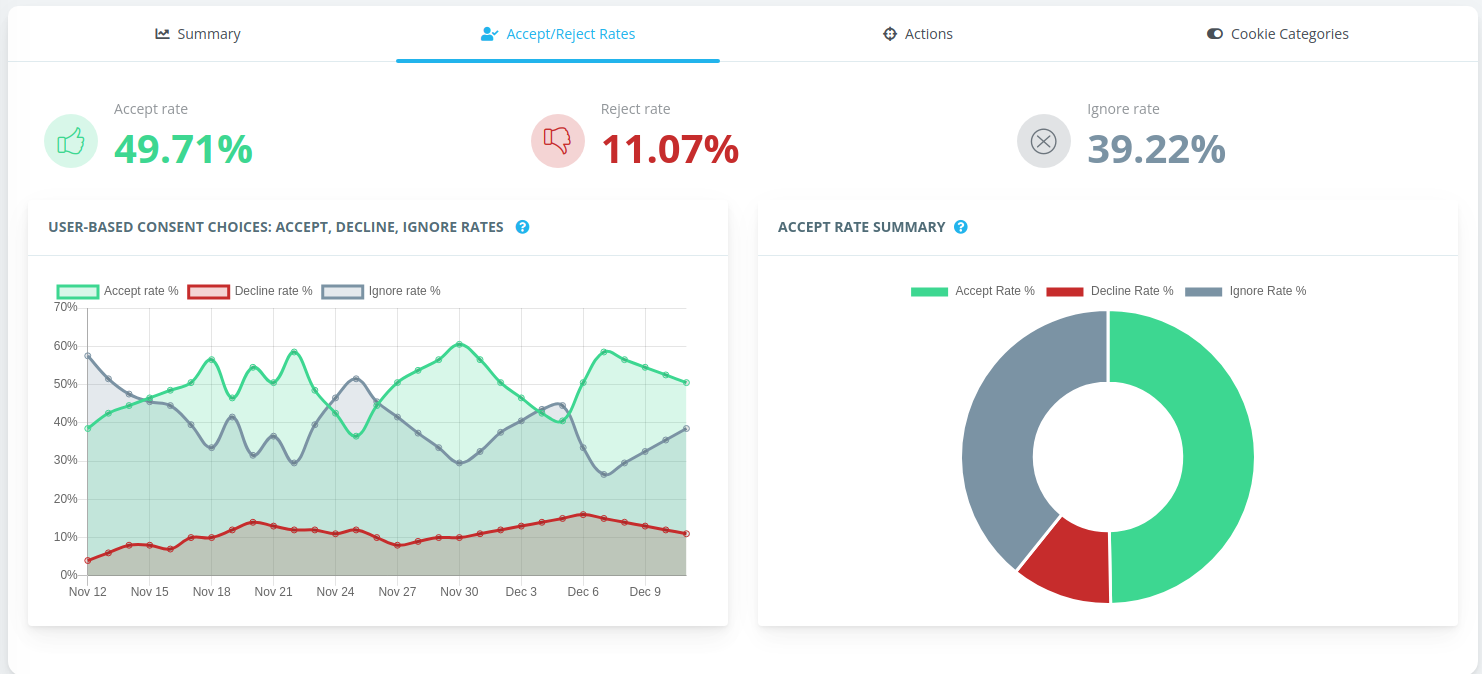
If users ignore the banner and continue browsing the website without any selection, it will be counted as the ignore rate, since the banner will be shown but ignored.
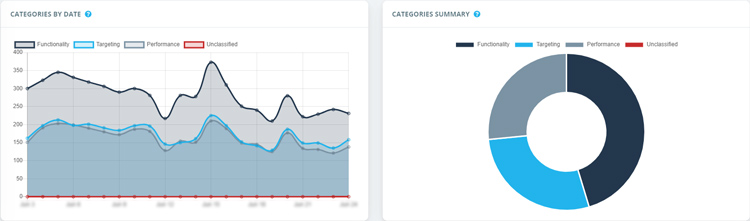
Cookie category preferences
The cookie category preferences section shows user preferences by categories: which Cookie Categories were selected and how often. This graph shows data for cases when individual categories were selected. If the user selects to accept all cookies, no individual categories are tracked. This graph is only available if you have scanned your website cookies and are actually using Cookie Categories.
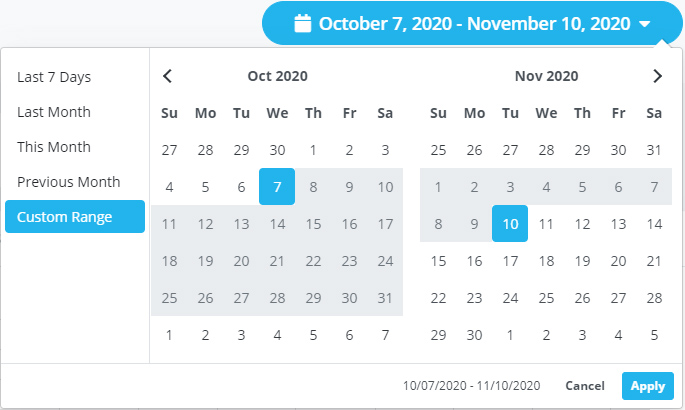
Date selection
We have added a convenient date selection that allows you to either choose a custom date range or select one of the pre-defined date ranges.